Serverless LLMs · part 1 of 7
- Anatomy of an LLM Cold Start, Part 1: Where the Time Goes
- Anatomy of an LLM Cold Start, Part 2: Make It Predictable, Then Make It Fast
- Anatomy of an LLM Cold Start, Part 3: A Checkpoint Format Written for the Reader
- ServerlessLLM Paper Breakdown, Part 1: Your GPU Server Is Also a Storage Server
- ServerlessLLM Paper Breakdown, Part 2: Migrate Tokens, Not Gigabytes
- ServerlessLLM Paper Breakdown, Part 3: Scheduling for Startup Time
- Serverless Agents: When Every Step Is a Cold Start
Why I am writing this
In 2024 my co-authors and I published ServerlessLLM at OSDI. The claim was that serverless LLM inference can start models 10 to 200 times faster than the systems people were using, by treating the storage that already sits inside a GPU server as a checkpoint cache. Later in this series I walk through that paper as a co-author, including the design ideas we tried and dropped, which did not fit in the paper.
However, I think a paper is not the best place to start. If you have never watched a model load, the term “cold start” is abstract and the paper’s numbers (34 seconds to load OPT-30B onto four GPUs) are hard to relate to. For this reason, the first three posts start from the bottom. I take a checkpoint apart on a laptop, measure every stage and rediscover the paper’s checkpoint format from the bottom up, one measurement at a time.
Everything runs on a MacBook. The numbers are smaller than on an 8-GPU server, but the same effects show up and where the two differ I point it out.
The setup
These are the machine, the model and the software used for every number in parts 1 to 3.
| Machine | Apple M1 Pro, 10 cores, 16 GiB unified memory |
| OS | macOS 26.5.2 |
| Python / torch | 3.12.11 / 2.13.0, device mps |
| Model | TinyLlama-1.1B-Chat-v1.0, 2.05 GiB of bf16 weights, 201 tensors |
| Disk | internal NVMe, page cache warm unless stated |
The model is small on purpose. It fits in memory three times over, which lets me run a loader in a fresh process for every measurement without swapping. A 7B model would not leave room for that on 16 GiB and a benchmark that ends up measuring swap would give misleading results.
The benchmark is the cold start of a process, not of a function call:
T_coldstart = (process start) -> (first generated token)
I break it into four stages and look at them one at a time:
download     bytes from object store / registry -> local disk
deserialise  bytes on disk                      -> torch tensors in DRAM
allocate     empty buffers on the accelerator
copy         DRAM                               -> accelerator memory
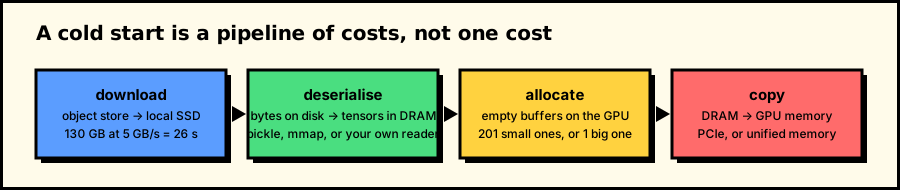
The four stages of a cold start. Each one is limited by a different resource: the network, the CPU, the allocator and the bus.
The scope of parts 1 to 3 is deliberately narrow: single node, single model, no scheduler, no quantisation, no compilation, fp16 weights as shipped. I am optimising loading, not inference. The download stage is a network problem and I leave it for the paper posts, where it turns out to be the largest cost.
Primer: what is actually in a checkpoint
A checkpoint is two things. There are execution files, which describe the architecture: how many layers, the shape of every tensor and on a multi-GPU model which GPU each tensor lands on. And there are parameter files, the actual bytes of the weights. Loading is the act of reading the second kind and arranging it the way the first kind wants.
Before optimising the read path, it is useful to look at what is being read. Here is the safetensors file, the Hugging Face default:
safetensors: header
  file size        2.05 GiB
  header           8 B length prefix + 22.55 KiB of JSON
  tensors          201
  __metadata__     {'format': 'pt'}

  The header is a single JSON dict: name -> {dtype, shape, data_offsets}.
  Everything after byte 8+hdr_len is one flat concatenation of raw tensor
  bytes. No pickle, no code execution and you can seek straight to any tensor.
Next, the order in which the tensors are stored on disk:
        offset        bytes  dtype    shape              name
             0    131072000  BF16     [32000, 2048]      lm_head.weight
     131072000    131072000  BF16     [32000, 2048]      model.embed_tokens.weight
     262144000         4096  BF16     [2048]             model.layers.0.input_layernorm.weight
     262148096     23068672  BF16     [2048, 5632]       model.layers.0.mlp.down_proj.weight
     285216768     23068672  BF16     [5632, 2048]       model.layers.0.mlp.gate_proj.weight
     308285440     23068672  BF16     [5632, 2048]       model.layers.0.mlp.up_proj.weight

  padding/gaps     0 B  (safetensors packs tensors back to back)
  not 4 KiB aligned 201/201 tensors
  => a page-aligned or O_DIRECT read has to split almost every tensor.

  tensors whose disk position != layer position: 200/201
The writer emitted tensors in dictionary order, so layers.10 lands on disk before layers.2and the output head comes before the embedding table. This does not matter when the file is written, which happens once. It matters when the file is loaded, which happens thousands of times and this observation is the starting point of the series.

Dictionary order on disk. A front-to-back read delivers the output head first and layer 10 before layer 2.
The older PyTorch format has a different problem:
torch.save (.bin): a zip of pickled storages
  file size        2.05 GiB
  zip members      207  (201 raw storages + pickle + version)
  compression      stored (none)

   data offset        bytes  member
            64        24981  model/data.pkl
         25536    131072000  model/data/0
     131097600    131072000  model/data/1

  storage payloads starting on a 4 KiB boundary: 3/201
It has two costs that safetensors avoids. The pickle must be executed to rebuild the tensor objects, so you cannot know where a tensor lives without walking it. And torch.load hands each storage to the allocator separately, so a 1.1B model becomes about 200 small allocations plus about 200 device copies.

The same 2.05 GiB. To find a tensor, the loader first has to run the pickle.
To summarise before any optimisation: 201 tensors, 2.05 GiB. Whatever I do next, the physical work is moving about 2 GiB from an SSD, through DRAM, into GPU memory. Any time spent beyond that is overhead added by the software and the next sections measure how much of it there is.
The floor
A useful baseline for a loader is read(2): reading the same file into a buffer and doing nothing with it.
The floor: read(2) the same file, do nothing with it
  2.05 GiB in   307.9 ms median (  7.15 GB/s), min   305.1 ms, max   370.7 ms
  CAVEAT: the page cache is warm, so this is the DRAM copy path, not the SSD.
Note the caveat, because it becomes important in part 2. With the file resident in the page cache, this is a memory-to-memory copy. The SSD number is lower. Both matter, because a serverless cold start on a busy node usually reads from the SSD.
The baseline
Next, the approach most people use: torch.load, then .to(device).
Baseline A: torch.load(map_location='cpu') then .to(device)
  run 1: total   1.004 s   (  2.19 GB/s, 201 tensors)
  run 2: total   430.6 ms  (  5.11 GB/s, 201 tensors)
  run 3: total   416.1 ms  (  5.29 GB/s, 201 tensors)

  stage                                time    share
  --------------------------------------------------
  deserialise (torch.load)         287.4 ms    69.1%
  allocate on device                 0.2 ms     0.0%
  copy host -> device              128.5 ms    30.9%
  --------------------------------------------------
  TOTAL                            416.1 ms   100.0%

Baseline B: torch.load(map_location='mps')
  median   454.8 ms  (  4.84 GB/s)  min   450.0 ms  max   464.3 ms
Run 1 stands out. The first load in a process is more than twice as slow as the second and nothing in the loader changed between them. That is the device runtime initialising and the allocator warming up. It is a fixed cost every fresh process pays and a serverless worker is a fresh process by definition. Keep that in mind for part 3.
Then compare the steady-state number with the floor:
  moving the bytes:        307.9 ms   (  7.15 GB/s)
  torch.load to the GPU:   416.1 ms   (  5.29 GB/s)
  ratio:                 1.4x slower than just reading the file
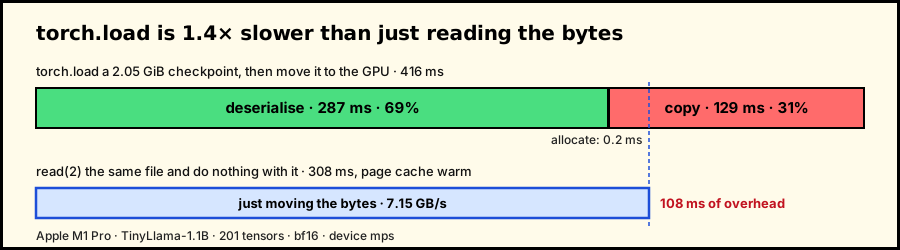
Deserialisation is 69% of the baseline. The floor is what the bytes alone cost.
This is an easy case: a 2 GiB model, on local NVMe, already warm in the page cache. The paper measures the same shape of problem at scale. Loading OPT-30B into four GPUs with PyTorch takes 34 seconds and LLaMA-2-70B into eight GPUs takes 84 seconds. These numbers are not limited by bandwidth, since the hardware could move the bytes in a few seconds. Meanwhile generating one token takes under 100 ms, so the user waits several hundred tokens’ worth of time before seeing the first one.
Three possible causes
Where does the extra 1.4x come from and why does it get so much worse at scale? I see three possible causes, which I look at in this order:
- Deserialisation walks a pickle and allocates 201 separate tensors before a byte reaches the device.
- The copy is 201 separate host-to-device transfers, each with its own launch and synchronisation cost.
- The read pattern is whatever the allocator happened to ask for, not the access pattern that suits the SSD best.
Part 2 addresses the first cause with safetensors, finds that “faster” and “predictable” are different goals and then looks at the read pattern directly with the page cache switched off. Part 3 changes the file format itself.